
For the first time, Hyundai has managed to beat the likes of Maruti and Mahindra – in the UV segment
The love for UVs of Indian customers is well known. Over the last few years, UV segment has registered strong double digit growths (except 2020, majorly due to the ongoing pandemic). Unsurprisingly, most OEMs have pivoted their strategy to focus more upon UVs, primarily SUVs and MUVs. This can be seen in the new launches of the OEMs as well.The New King of the Category
Here is a comparison of sales performance as well as market shares of various OEMs in the UV category for Q2 CY 2020 or Q1 FY 2021, which is the period from April 2020 to June 2020. Surprisingly, the market leader in the UV category currently happens to be Hyundai. Last year, it was Maruti Suzuki which had the title of being the UV king for the same time period as it had a market share of 25.5%. This year, Hyundai has beaten Maruti Suzuki and grabbed 23.6% market share in the UV category.
What is interesting is that Hyundai currently just has 2 major UVs, the 2020 Hyundai Creta and the Venue. It is impressive to see Hyundai performing so well with just 2 models in its portfolio (sales of Tuscon are relatively insignificant). Last year, Hyundai had a market share of 20.7% and now it has improved it by around 3%.
The second OEM on the list happens to be Maruti Suzuki with a market share of 22.5%. It has lost its market share by around 3% as it commanded a MS of 25.5% last year. Partially, the loss can be attributed to its decision of discontinuation of diesel engine option. Brezza has lost huge sales due to this.
The clear shocker happens to be Mahindra, which once used to be the leader in the SUV segment. It has seen its market share eroding from 24.8% last year to just 15.6% this year. It is to be noted that Mahindra’s portfolio majorly comprises of SUVs only (XUV300, XUV500, TUV300, Scorpio, Thar, Alturas G4, Bolero). The performance of the 2020 Thar and the upcoming next generation Scorpio and XUV500 will clearly define the future trajectory for the company.
New Kid on the Block – Kia Motors
The fourth OEM on the list is Kia, which is a new entrant in the market. Kia has used an UV oriented launch strategy and hence all its products, Seltos, Carnival & the upcoming Sonet cater to the same segment. Kia has managed to gain a market share of 12% in the UV space, which is commendable for a new player. Interestingly, Kia is a subsidiary of Hyundai. Some are of the opinion that Hyundai + Kia sales could become higher than that of Maruti in coming years.
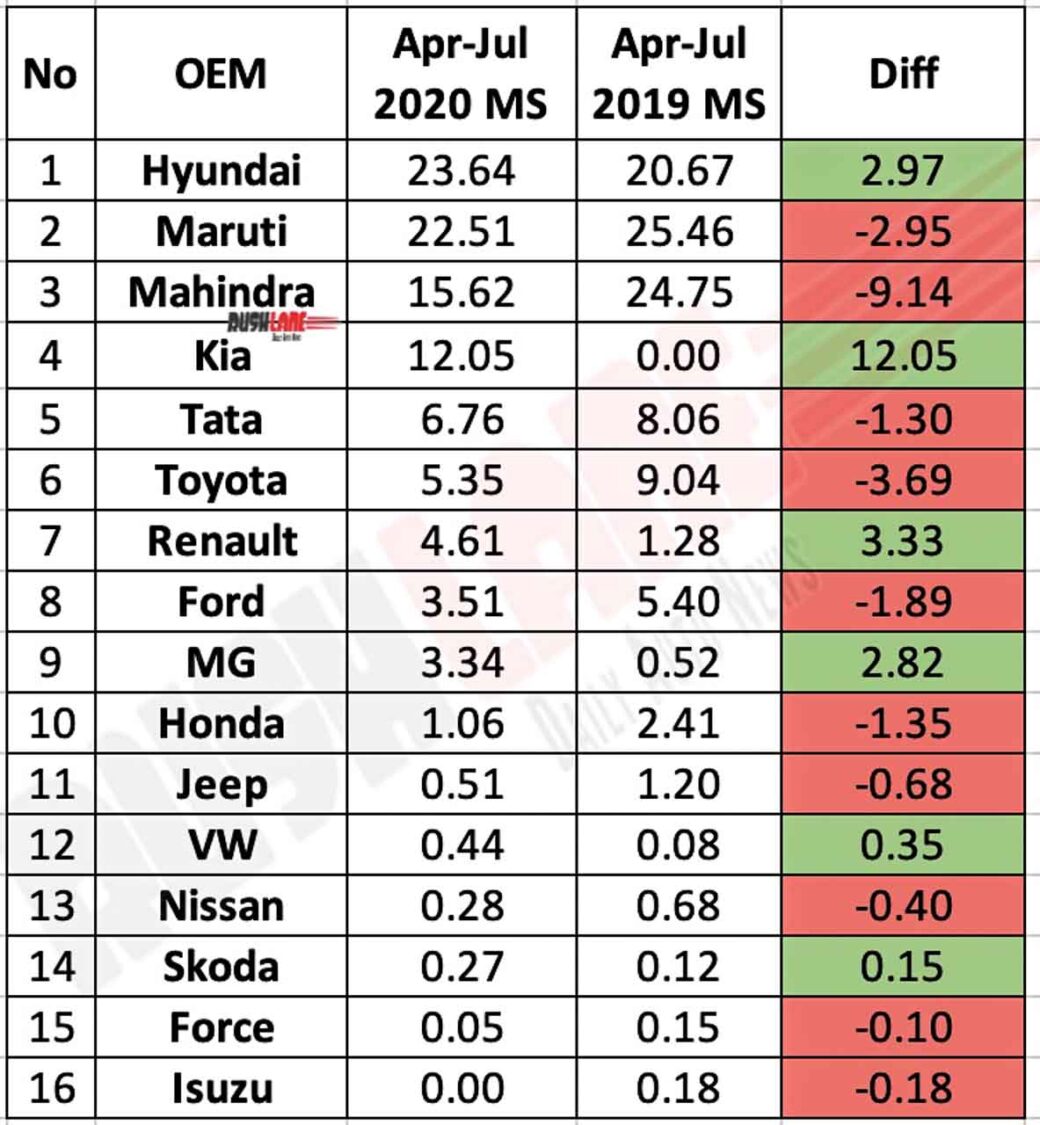
Tata Motors finds itself on the fifth spot with a market share of 6.8%. Toyota follows closely on the 6th spot with a market share of 5.4%. Renault has seen some considerable improvement in its performance over the last year. It has managed to improve its MS from 1.3% last year to 4.6% this year, majorly due to the launch of the Triber.
MG Motor India too has been improving its market share consistently, majorly due to its UV-oriented focus. Just like Kia, all its products too cater to the same UV segment, be it the Hector/ZS EV/Hector Plus or the upcoming Gloster.
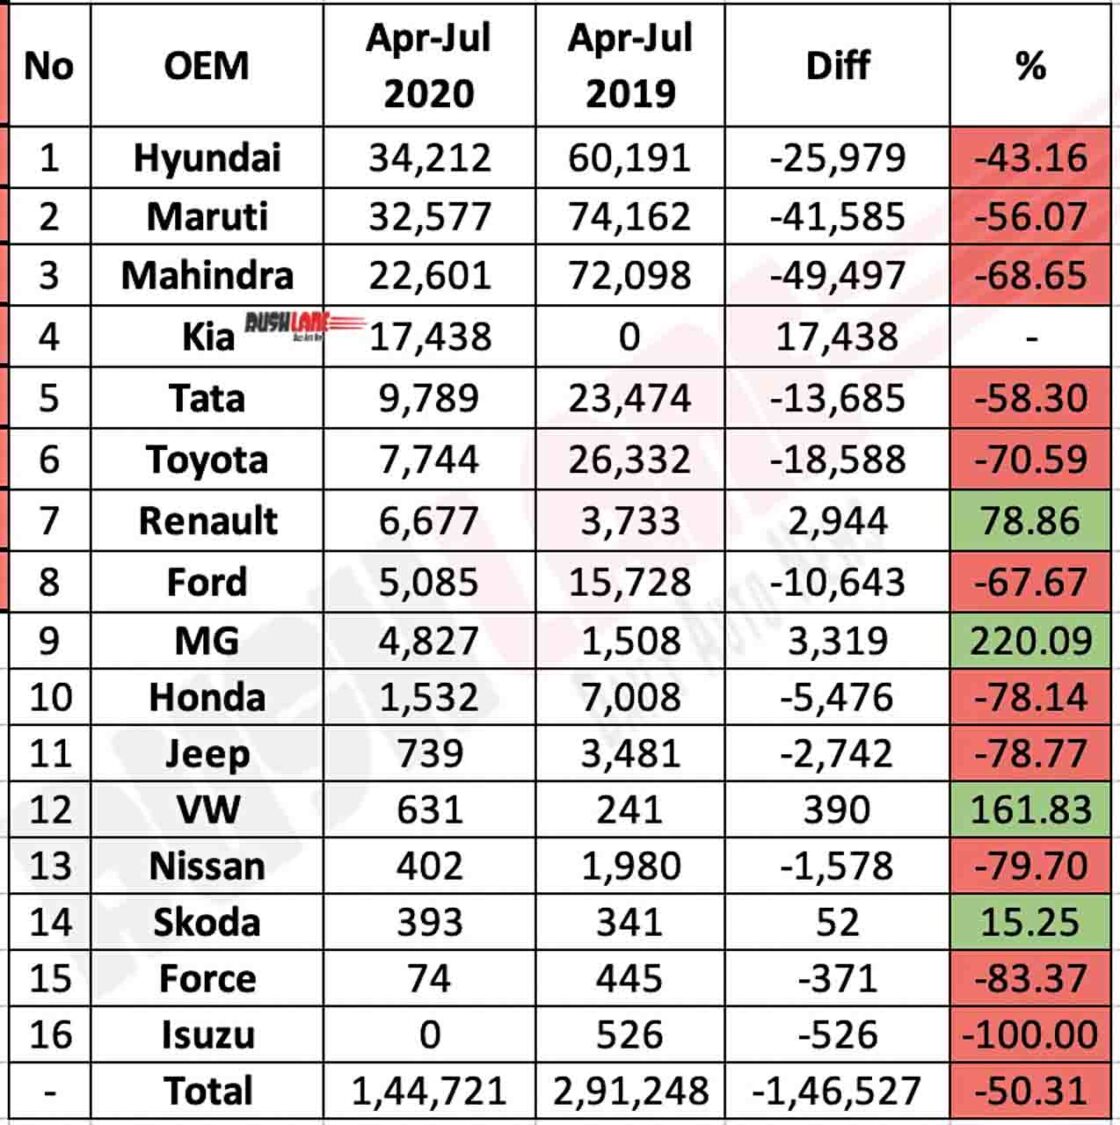
| No | OEM | Apr-Jul 2020 | Apr-Jul 2019 | Diff | % |
|---|---|---|---|---|---|
| 1 | Hyundai | 34,212 | 60,191 | -25,979 | -43.16 |
| 2 | Maruti | 32,577 | 74,162 | -41,585 | -56.07 |
| 3 | Mahindra | 22,601 | 72,098 | -49,497 | -68.65 |
| 4 | Kia | 17,438 | 0 | 17,438 | – |
| 5 | Tata | 9,789 | 23,474 | -13,685 | -58.30 |
| 6 | Toyota | 7,744 | 26,332 | -18,588 | -70.59 |
| 7 | Renault | 6,677 | 3,733 | 2,944 | 78.86 |
| 8 | Ford | 5,085 | 15,728 | -10,643 | -67.67 |
| 9 | MG | 4,827 | 1,508 | 3,319 | 220.09 |
| 10 | Honda | 1,532 | 7,008 | -5,476 | -78.14 |
| 11 | Jeep | 739 | 3,481 | -2,742 | -78.77 |
| 12 | VW | 631 | 241 | 390 | 161.83 |
| 13 | Nissan | 402 | 1,980 | -1,578 | -79.70 |
| 14 | Skoda | 393 | 341 | 52 | 15.25 |
| 15 | Force | 74 | 445 | -371 | -83.37 |
| 16 | Isuzu | 0 | 526 | -526 | -100.00 |
| – | Total | 1,44,721 | 2,91,248 | -1,46,527 | -50.31 |
| No | OEM | Apr-Jul 2020 MS | Apr-Jul 2019 MS | Diff | |
| 1 | Hyundai | 23.64 | 20.67 | 2.97 | |
| 2 | Maruti | 22.51 | 25.46 | -2.95 | |
| 3 | Mahindra | 15.62 | 24.75 | -9.14 | |
| 4 | Kia | 12.05 | 0.00 | 12.05 | |
| 5 | Tata | 6.76 | 8.06 | -1.30 | |
| 6 | Toyota | 5.35 | 9.04 | -3.69 | |
| 7 | Renault | 4.61 | 1.28 | 3.33 | |
| 8 | Ford | 3.51 | 5.40 | -1.89 | |
| 9 | MG | 3.34 | 0.52 | 2.82 | |
| 10 | Honda | 1.06 | 2.41 | -1.35 | |
| 11 | Jeep | 0.51 | 1.20 | -0.68 | |
| 12 | VW | 0.44 | 0.08 | 0.35 | |
| 13 | Nissan | 0.28 | 0.68 | -0.40 | |
| 14 | Skoda | 0.27 | 0.12 | 0.15 | |
| 15 | Force | 0.05 | 0.15 | -0.10 | |
| 16 | Isuzu | 0.00 | 0.18 | -0.18 |